

Note
Go to the end to download the full example code.
Multi-Band ToO Follow-up#
The primary design scope of uvex-transients is to simulate yields from UVEX’s various
surveys; however, there will certainly be cases when UVEX observes sources with corresponding OIR data
from ZTF / Rubin / other ground based surveys. In some cases, this may be serendipetous, but in others, it
may be because the sources was discovered and classified by a ground based observatory and a TOO was triggered
on UVEX.
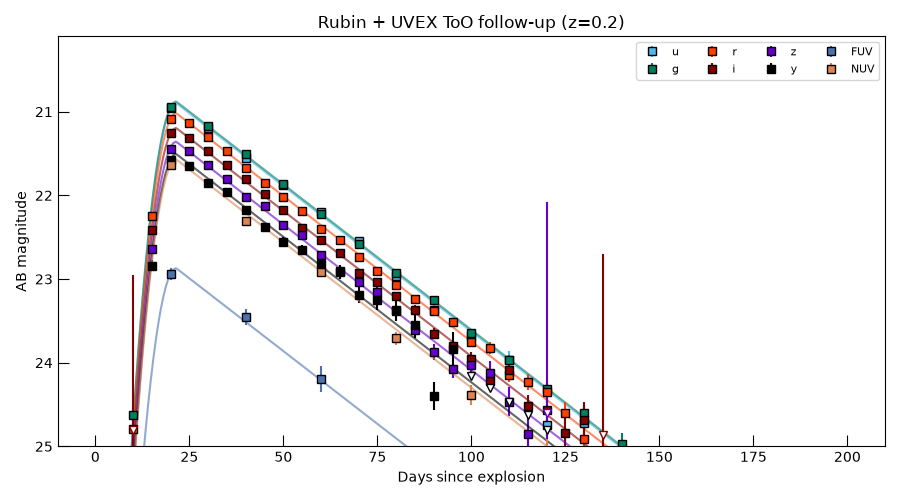
In this example, we’ll show off a simulation of this sort of scenario: Rubin gets on target first and starts a multi-band follow-up campaign of its own, then UVEX is triggered and joins in with its two UV bands.
import numpy as np
from astropy import units as u
from astropy.coordinates import SkyCoord
from astropy.table import vstack
from m4opt.missions import rubin, uvex
from m4opt.synphot.background import GalacticBackground, SkyBackground
from matplotlib import pyplot as plt

from uvex_transients.dust import dust_map, log_attenuation, resolve_ebv
from uvex_transients.transients.TDEs import TidalDisruptionEvent
from uvex_transients.utils.plotting import get_band_color, plot_band_light_curve, resolve_fig_axes, set_plot_style

set_plot_style()

# Configure the transient and its parameters.
tde = TidalDisruptionEvent()

coord = SkyCoord(ra=195.3 * u.deg, dec=27.8 * u.deg)
redshift = 0.2
luminosity_distance = tde.cosmology.luminosity_distance(redshift)

# Determine the redenning from the dust map.
ebv = float(resolve_ebv(dust_map(), coord))

params = {name: value[0] for name, value in tde.sed.sample_parameters(1, rng=12345).items()}
print(f"E(B-V) at target: {ebv:.3f}")
print("SED parameters:", {name: f"{value:.3g}" for name, value in params.items()})
E(B-V) at target: 0.007
SED parameters: {'amplitude': '2.36e+43 erg / s', 'sigma_rise': '3.58 d', 'tau_decline': '26 d', 'temperature': '1.44e+04 K'}
Choosing the cadences#
Rubin’s redder bands (r/i/z/y) get visited every 5 days and its bluer
bands (u/g) every 10 days – roughly the cadence split of the Rubin/LSST
wide-fast-deep baseline,
all at Rubin’s standard 30 s visit exposure time. UVEX joins on its own 10-day
cadence for FUV/NUV. Every band that shares an (instrument, cadence) pair
also shares one time grid, so simulate_photometry()
only needs to be called once per group.
RUBIN_CADENCES = {
    "u": 10 * u.day,
    "g": 10 * u.day,
    "r": 5 * u.day,
    "i": 5 * u.day,
    "z": 5 * u.day,
    "y": 5 * u.day,
}
RUBIN_EXPTIME = 30 * u.s
UVEX_CADENCE = 20 * u.day
UVEX_EXPTIME = 900 * u.s

# Rubin/LSST's own systematic photometric calibration floor (Table 14 of the LSST
# Science Requirements Document, LPM-17 -- the same `sigma_sys` `rubin_sim.phot_utils`
# uses), in magnitudes. `simulate_photometry`'s own noise model is shot noise only
# (source + sky Poisson, detector read/dark noise, via the standard CCD equation); it
# has no notion of flat-fielding, PSF-fit, or zeropoint calibration systematics, which
# is why bright-end Rubin points would otherwise come out implausibly precise. UVEX's
# points are left as pure shot noise -- no comparably-established floor for it here.
RUBIN_SIGMA_SYS = {
    "u": 0.0075,
    "g": 0.005,
    "r": 0.005,
    "i": 0.005,
    "z": 0.0075,
    "y": 0.0075,
}

rubin_band_groups: dict[u.Quantity, list[str]] = {}
for band, cadence in RUBIN_CADENCES.items():
    rubin_band_groups.setdefault(cadence, []).append(band)
Simulating photometry#
As in the single-instrument case, there’s no known real trigger time, so each
instrument’s background is chosen so that it doesn’t need one:
SkyBackground.medium() for Rubin (a fixed dark-sky brightness condition, no
zodiacal light) and GalacticBackground() for UVEX (the Milky Way’s diffuse UV
glow only), leaving observer_location/obstime at their placeholder
defaults. See simulate_photometry()’s
own docstring for exactly when that placeholder default is (and isn’t) safe.
Each (instrument, cadence) group gets its own simulate_photometry call and the
resulting tables are stacked together afterwards, tagged with an instrument
column. Rubin’s call also passes sys_err=RUBIN_SIGMA_SYS, so its
snr/flux_err/mag_err – and the simulated flux/ab_mag draw
itself – reflect the combined shot-noise-plus-systematic uncertainty; UVEX’s call
doesn’t, so its points stay pure shot noise.
tables = []

for cadence, bands in rubin_band_groups.items():
    t_rubin = np.arange(0, tde.duration_limit.to_value(u.day), cadence.to_value(u.day)) * u.day
    phot_group = tde.sed.simulate_photometry(
        t_rubin,
        RUBIN_EXPTIME,
        rubin.detector,
        coord,
        bands=bands,
        background=SkyBackground.medium(),
        redshift=redshift,
        luminosity_distance=luminosity_distance,
        ebv=ebv,
        sys_err=RUBIN_SIGMA_SYS,
        rng=0,
        **params,
    )
    phot_group["instrument"] = "Rubin"
    tables.append(phot_group)
    print(f"Rubin {'/'.join(bands)}: {len(t_rubin)} visits, one every {cadence}.")

t_uvex = np.arange(0, tde.duration_limit.to_value(u.day), UVEX_CADENCE.to_value(u.day)) * u.day
phot_uvex = tde.sed.simulate_photometry(
    t_uvex,
    UVEX_EXPTIME,
    uvex.detector,
    coord,
    background=GalacticBackground(),
    redshift=redshift,
    luminosity_distance=luminosity_distance,
    ebv=ebv,
    rng=0,
    **params,
)
phot_uvex["instrument"] = "UVEX"
print(f"UVEX FUV/NUV: {len(t_uvex)} visits, one every {UVEX_CADENCE}.")
tables.append(phot_uvex)

phot = vstack(tables)
phot.sort(["t", "band"])
print(phot["t", "instrument", "band", "snr", "ab_mag"][:6])
Rubin u/g: 20 visits, one every 10.0 d.
Rubin r/i/z/y: 40 visits, one every 5.0 d.
UVEX FUV/NUV: 10 visits, one every 20.0 d.
 t  instrument band          snr                 ab_mag
 d
--- ---------- ---- ---------------------- ------------------
0.0       UVEX  FUV 0.00013221681436506683  28.99481738028228
0.0       UVEX  NUV  0.0006738824614370494                nan
0.0      Rubin    g  0.0015027763939941836                nan
0.0      Rubin    i  0.0006517172496378308                nan
0.0      Rubin    r  0.0008886615886936758 29.203724142556172
0.0      Rubin    u  0.0006981291295000424 28.824280282178023
The light curves#
The noiseless theory curve (mag(),
evaluated at each band’s pivot wavelength) alongside the simulated visits from both
instruments: detections above SNR=5 as points with error bars, fainter visits as
downward-pointing upper limits – the same plotting convention used at the end of
TDE End-to-End Simulation.
SNR_THRESHOLD = 5.0
t_theory = np.linspace(0, tde.duration_limit.to_value(u.day), 300) * u.day

band_detectors = {band: rubin.detector for band in RUBIN_CADENCES} | {
    "FUV": uvex.detector,
    "NUV": uvex.detector,
}

fig, ax = resolve_fig_axes(fig_size=(9, 5))
for band, detector in band_detectors.items():
    nu = detector.bandpasses[band].pivot().to(u.Hz, equivalencies=u.spectral())
    theory_mag = tde.sed.mag(
        nu,
        t_theory,
        redshift=redshift,
        luminosity_distance=luminosity_distance,
        log_attenuation=log_attenuation(nu, ebv),
        **params,
    )
    plot_band_light_curve(
        ax,
        band,
        phot["t"],
        phot,
        t_theory=t_theory,
        theory_mag=theory_mag,
        snr_threshold=SNR_THRESHOLD,
        color=get_band_color(band),
        label=band,
    )

ax.invert_yaxis()
ax.set_xlabel("Days since explosion")
ax.set_ylabel("AB magnitude")
ax.set_ylim([25, None])
ax.set_title(f"Rubin + UVEX ToO follow-up (z={redshift})")
ax.legend(ncol=4, fontsize=8)
fig.tight_layout()
plt.show()
Total running time of the script: (0 minutes 0.247 seconds)